Changelog
Contextual pivots
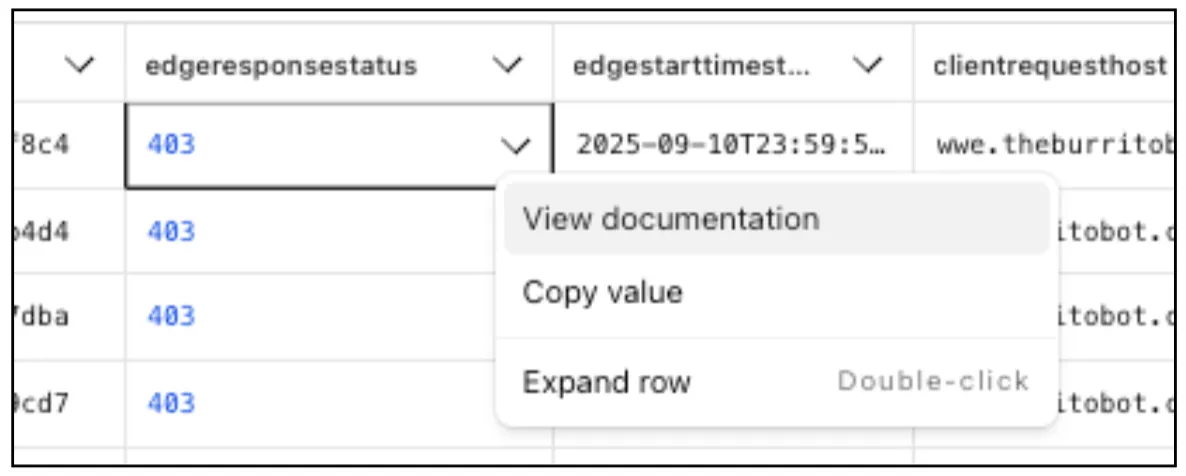
Directly from Log Search results, customers can pivot to other parts of the Cloudflare dashboard to immediately take action as a result of their investigation.
From the http_requests or fw_events dataset results, right click on an IP Address or JA3 Fingerprint to pivot to the Investigate portal to lookup the reputation of an IP address or JA3 fingerprint.

Easily learn about error codes by linking directly to our documentation from the EdgeResponseStatus or OriginResponseStatus fields.
From the gateway_http dataset, click on a policyid to link directly to the Zero Trust dashboard to review or make changes to a specific Gateway policy.

New results table view
The results table view of Log Search has been updated with additional functionality and a more streamlined user experience. Users can now easily:
- Remove/add columns.
- Resize columns.
- Sort columns.
- Copy values from any field.

Logging headers and cookies using custom fields
Log Explorer now supports logging and filtering on header or cookie fields in the http_requests dataset.
Create a custom field to log desired header or cookie values into the http_requests dataset and Log Explorer will import these as searchable fields. Once configured, use the custom SQL editor in Log Explorer to view or filter on these requests.
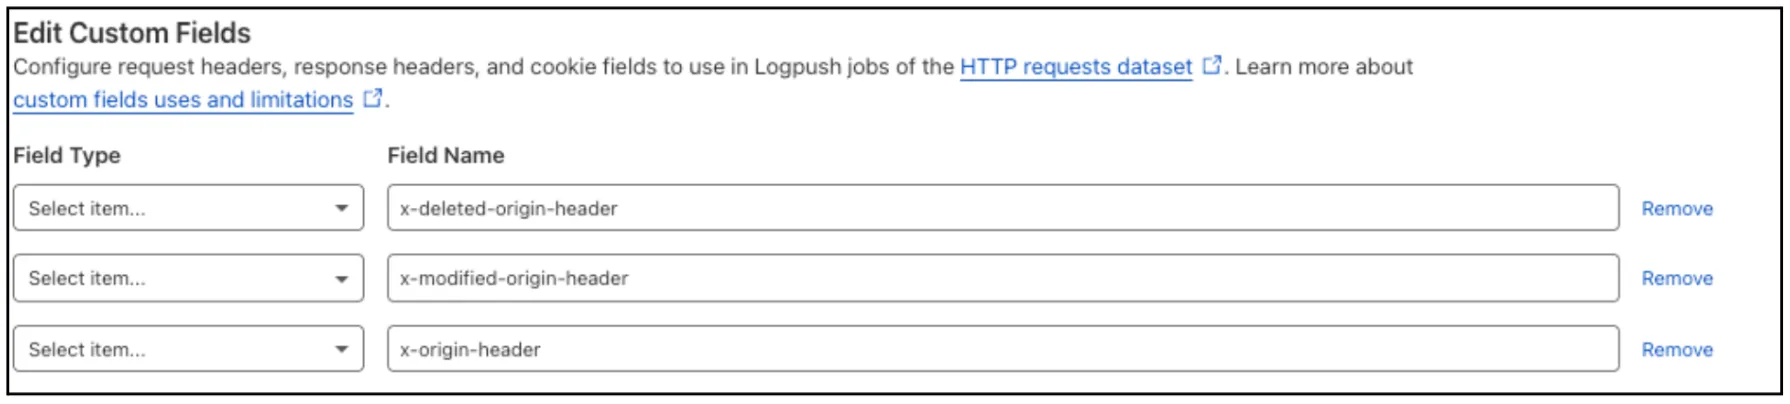
For more details, refer to Headers and cookies.
Extended retention
Customers can now rely on Log Explorer to meet their log retention compliance requirements.
Contract customers can choose to store their logs in Log Explorer for up to two years, at an additional cost of $0.10 per GB per month. Customers interested in this feature can contact their account team to have it added to their contract.
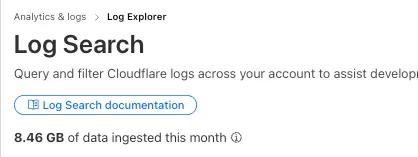
Usage tracking
Log Explorer customers can now monitor their data ingestion volume to keep track of their billing. Monthly usage is displayed at the top of the Log Search and Manage Datasets screens in Log Explorer.
Log Explorer is GA
Log Explorer is now GA, providing native observability and forensics for traffic flowing through Cloudflare.
Search and analyze your logs, natively in the Cloudflare dashboard. These logs are also stored in Cloudflare's network, eliminating many of the costs associated with other log providers.
With Log Explorer, you can now:
- Monitor security and performance issues with custom dashboards – use natural language to define charts for measuring response time, error rates, top statistics and more.
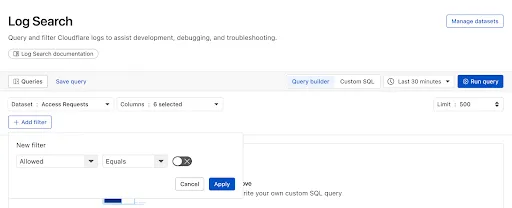
- Investigate and troubleshoot issues with Log Search – use data type-aware search filters or custom sql to investigate detailed logs.
- Save time and collaborate with saved queries – save Log Search queries for repeated use or sharing with other users in your account.
- Access Log Explorer at the account and zone level – easily find Log Explorer at the account and zone level for querying any dataset.
For help getting started, refer to our documentation.
Was this helpful?
- Resources
- API
- New to Cloudflare?
- Directory
- Sponsorships
- Open Source
- Support
- Help Center
- System Status
- Compliance
- GDPR
- Company
- cloudflare.com
- Our team
- Careers
- © 2025 Cloudflare, Inc.
- Privacy Policy
- Terms of Use
- Report Security Issues
- Trademark